EXERCISE 4 - Data Analysis - Regression Analysis
- Plot a graph of Pressure vs Temperature, remembering to label axes and to give the chart an appropriate title.
- Assuming all pressure readings have the same error as that determined in Exercise 2, add error bars to the chart.
- Add a linear trendline to your plot.
- Perform a linear regression on your Pressure-Temperature data, ignoring the repeat readings.
- Using the Ideal-gas equation and your results, calculate (with an error estimate) the gas concentration in units of mM.
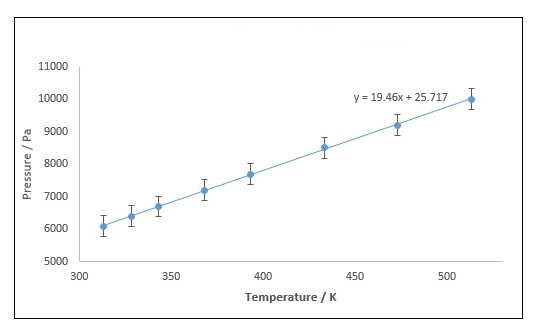
- Your graph should look like this:
- The gas concentration with associated error is: