Using Excel 2013 - Mean (with associated Error)
| *If Data Analysis... is not present under the Data tab, it will need to be added by following these instructions. |
(VIEW THIS TUTORIAL AS A VIDEO)
To calculate the mean (with associated error) on a set of multiple measurements, use the following procedure:
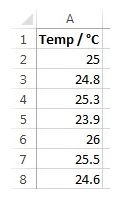
| 1. | Select a new worksheet. Enter the following data into Column A of the sheet as showed on right. |  |
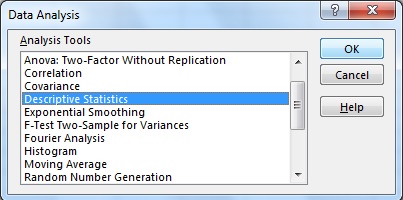
| 2. | Select the Data tab and click on Data Analysis. |  |
| 3. | Select Descriptive Statistics then click OK. |  |
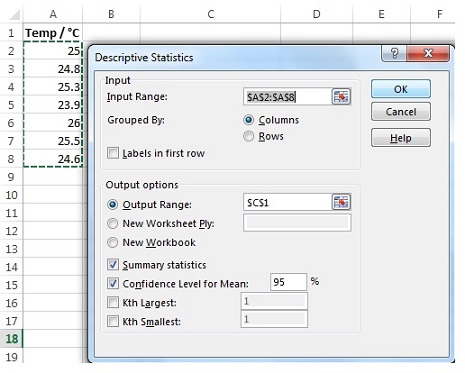
| 4. | Make sure the flashing cursor is in the window to the right of Input Range. |  |
| 5. | Highlight the cells containing your data by clicking and dragging the mouse from cell A2 to the end of your data. The cell addresses of your data should appear in the window to the right of Input Range. | |
| 6. | Under Output options, click on the circle to the left of Output Range. | |
| 7. | Make sure the flashing cursor is in the window to the right of Output Range. | |
| 8. | Click on the cell C1 in the spreadsheet. This address should appear in the window to the right of Output Range. | |
| 9. | Then click on the box to the left of Summary statistics and the box to the left of Confidence Level for Mean. | |
| 10. | Click OK. | |
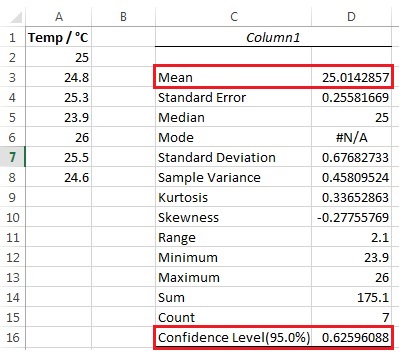
| 11. | Your spreadsheet should look like that shown opposite. We are interested in the Mean and Confidence Level (95%) results. Remember, the Confidence Level (95%) is our estimate of the error on the mean. In this case result can be quoted as:
(25.0 ± 0.6) °C
|  |