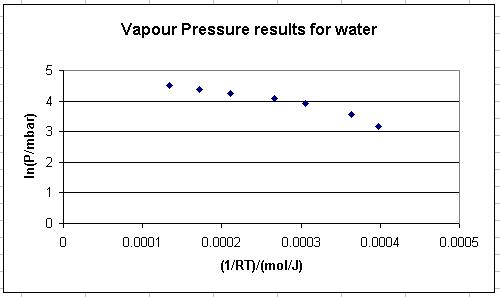
In this example, the y-axis of a graph will rescaled. Obviously, a similar procedure may be used to rescale the x-axis.
Click the mouse somewhere on the Chart or Plot Area of the graph.
Move the mouse until it is touching the y-axis, is not close to a tick mark and the pop-up caption Value (Y) Axis appears.
Right click the mouse and select Format Axis... from the options that appear.
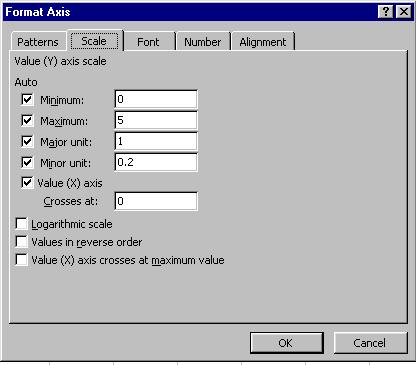
Select the Scale tab from the top of the box that appears. You should now see the scale box as shown below.
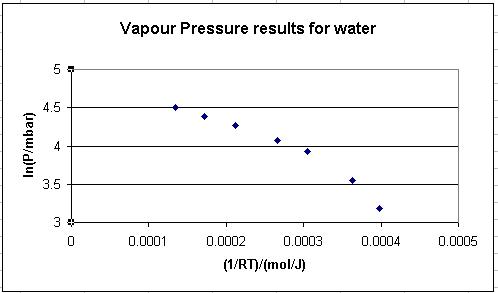
Untick the boxes to the left of Minimum: and Maximum:. Enter in the boxes to the right of Minimum: and Maximum: the values that you wish the y-axis to start and end at.