Using Origin 2017
Plotting a Graph (Line of Best Fit)
Having plotted a graph in Origin, a line of best fit can be added as follows:
| 1. | Click on Analysis → Fitting → Linear Fit → Open Dialog. | 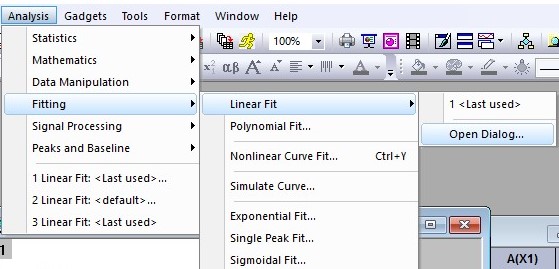 |
| 2. | Click on "OK" when the Linear Fit dialog box appears. | 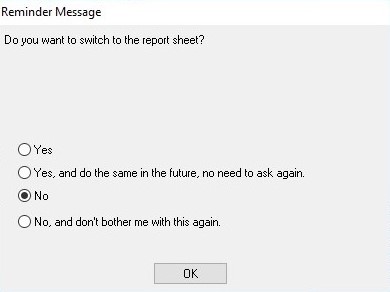 |
| 3. | Select "No" when asked whether to be directed to the report sheet. |
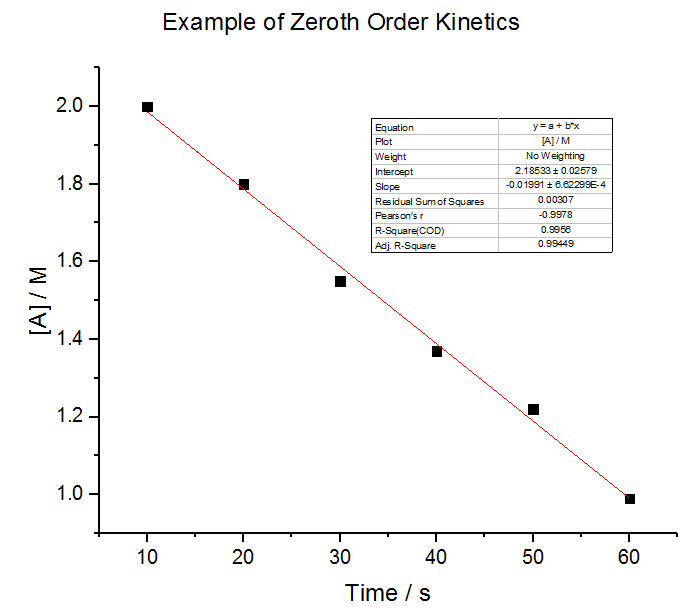 Once completed the plot should appear with a trendline and a table containing information about the fitted trendline.
IMPORTANT NOTE: The error displayed in the table for the Slope and Intercept are the standard errors for these parameters. In the Level 4 Labs the 95% Confidence Level and NOT the standard error should be used. The 95% CL can easily be determined using Excel.