Using Excel 2013 - Add Error Bars to a Graph
(VIEW THIS TUTORIAL AS A VIDEO)
The estimated error on each point in the graph should be displayed as "error bars". Any line which fits all the experimental points within their estimated error ranges is in agreement with experiment. Small residual misfits (i.e. the line only just fails to fit the experimental points and their errors) may well be due to underestimation of the limits of error of individual readings.
The following procedure (using the graph generated in the Plotting Graphs section of this tutorial) details how these can be added:
| 1. | Click on the Design tab under Chart Tools. | |
| 2. | Click on Add Chart element and select Error Bars, followed by More Error Bars Options. | 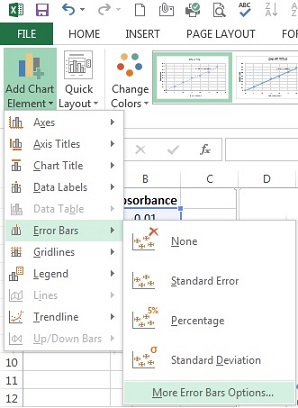 |
| 3. | On right will appear Format Error Bars window.
Click on the circle to the left of Custom, then click Specify Value. | 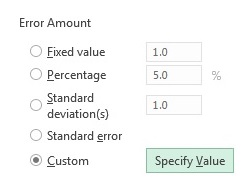 |
| 4. | Type 0.03 (the estimated error on the absorbance measurements in this example) in both boxes. | |
| 5. | Click on OK. | 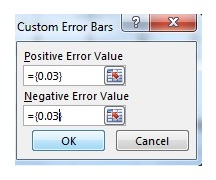 |
| 6. | If no errors are associated with measurements plotted on x-axis, then click on one of horizontal error bars and press Delete. If there are, then right click on one of the x-error bars on your plot then add error value in similar manner as in step 4. Your graph should now look like that shown opposite. Note: X-axis error bars were deleted in this example. | 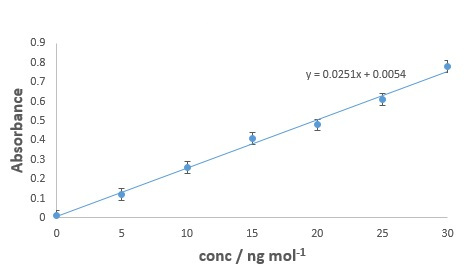 |