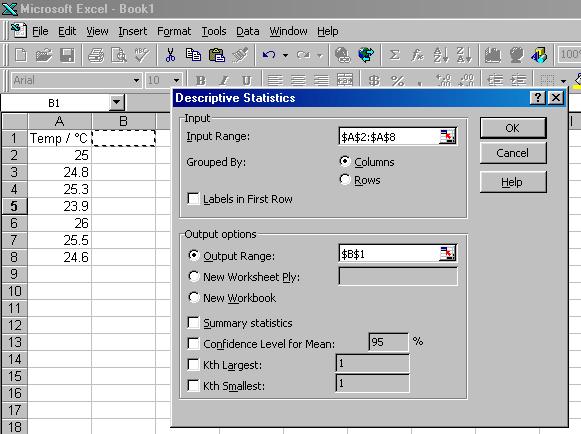
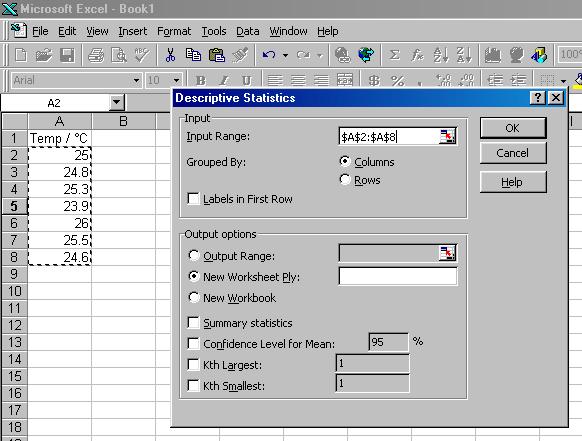
 Under Output options, click on the circle to the left of Output Range.
Make sure the flashing cursor is in the window to the right of Output Range.
Click on the cell B1 in the spreadsheet. This address should appear in the window to the right of Output Range.
Finally, click on the box to the left of Summary statistics, and then click on OK.
Under Output options, click on the circle to the left of Output Range.
Make sure the flashing cursor is in the window to the right of Output Range.
Click on the cell B1 in the spreadsheet. This address should appear in the window to the right of Output Range.
Finally, click on the box to the left of Summary statistics, and then click on OK.
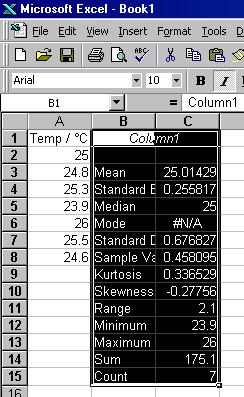
Your spreadsheet should now look like the figure below.
We are interested in the Mean and error. The Standard Error is an estimate of the error associated with the Mean. However the Standard Error is evaluated assuming that the data supplied is a representative sample of how the deviations vary around the true value, i.e. the fewer data points available, the less confident you can be that the Standard Error represents a good estimate of the actual error.
This problem is addressed by the use of t-values. A t-value can be looked up for the number of data points in the data set, and used to scale the Standard Error appropriately, i.e. Error = ± ( t-value x Standard Error). The scaled value is known as the 95% Confidence Level, since we are 95% certain that the true error is no larger than this.
Rather than multiplying the Standard Error by a t-value (you have looked up), the 95% Confidence Level will be determined for you when you perform a Descriptive Statistics Analysis in Excel, if the box to the left of Confidence Level for Mean: 95 % is selected when you set up the analysis.
|